Practical Analytics Framework And Tool To Make Better Decisions
“You can start thinking like a data scientist by asking three simple questions,” Brock said.
1. What should we know?
2. What can we know?
3. What should we do?
Three questions.
Twelve words total.
“Way too often,” Brock explained, “people, in the C-Suite executives or on the front line closest to customers, they skip questions one and two—the thinking questions—and they jump right to question three, the doing question.”
As someone who often defaults to the Ready-Fire-Aim approach to decision-making, I immediately recognized what Brock left unsaid: Outcomes improve when more thinking precedes doing.
This conversation took place in early 2020 and kickstarted our journey into construction analytics. As I spoke to our clients—commercial and residential GCs, subcontractors, material suppliers, distributors, manufacturers, and universities—there was broad recognition that data creation was not the problem.
More than ever, relevant data was spilling out from every organizational orifice.
No, the problem was what to do with the data: How to collect it, organize it, analyze it, and generate insights from it.
And then, of course, allow those insights to drive behaviors.
Small, clearly defined construction analytics projects with clients began.
We evaluated the historic performance of a group of Project Managers and their ability to lead profitable jobs.
We did a deep dive into product margin variance among what we dubbed The Golden Triangle of Sales: sales rep, inside sales coordinator, and builder. (I’ll confirm what you already know: there is often immense margin variability within the same organization selling the same products to similar builders. Suffice to say there are pros and cons when it comes to autonomy and pricing authority.)
We developed predictive sales models for lumber dealers and a budget forecasting data visualization tool for GCs. We determined the correlation between safety performance, project leadership, and safety documentation for a client.
With each project, we became better translators between our PhD data scientist partners and our clients who were busy building America.
Data visualizations generated insights faster. Linked to training, behaviors changed faster. Outcomes, small and large, improved.
1. What should we know?
2. What can we know?
3. What should we do?
I then asked our analytics team to develop an automated construction index and visualization tool that could be shared with clients. It would provide trend insights on the various segments of the construction industry we serve.
“Must be automated and easy to understand,” I wrote in the specs.
The bh&co. Construction Index would capture real-time stock prices from publicly traded firms —broken down by industry segment—in the construction industry to increase awareness of the public perception of those firms and better inform decision making under economic uncertainty.
We chose five category segments and identified the relevant firms in the Fortune 500.
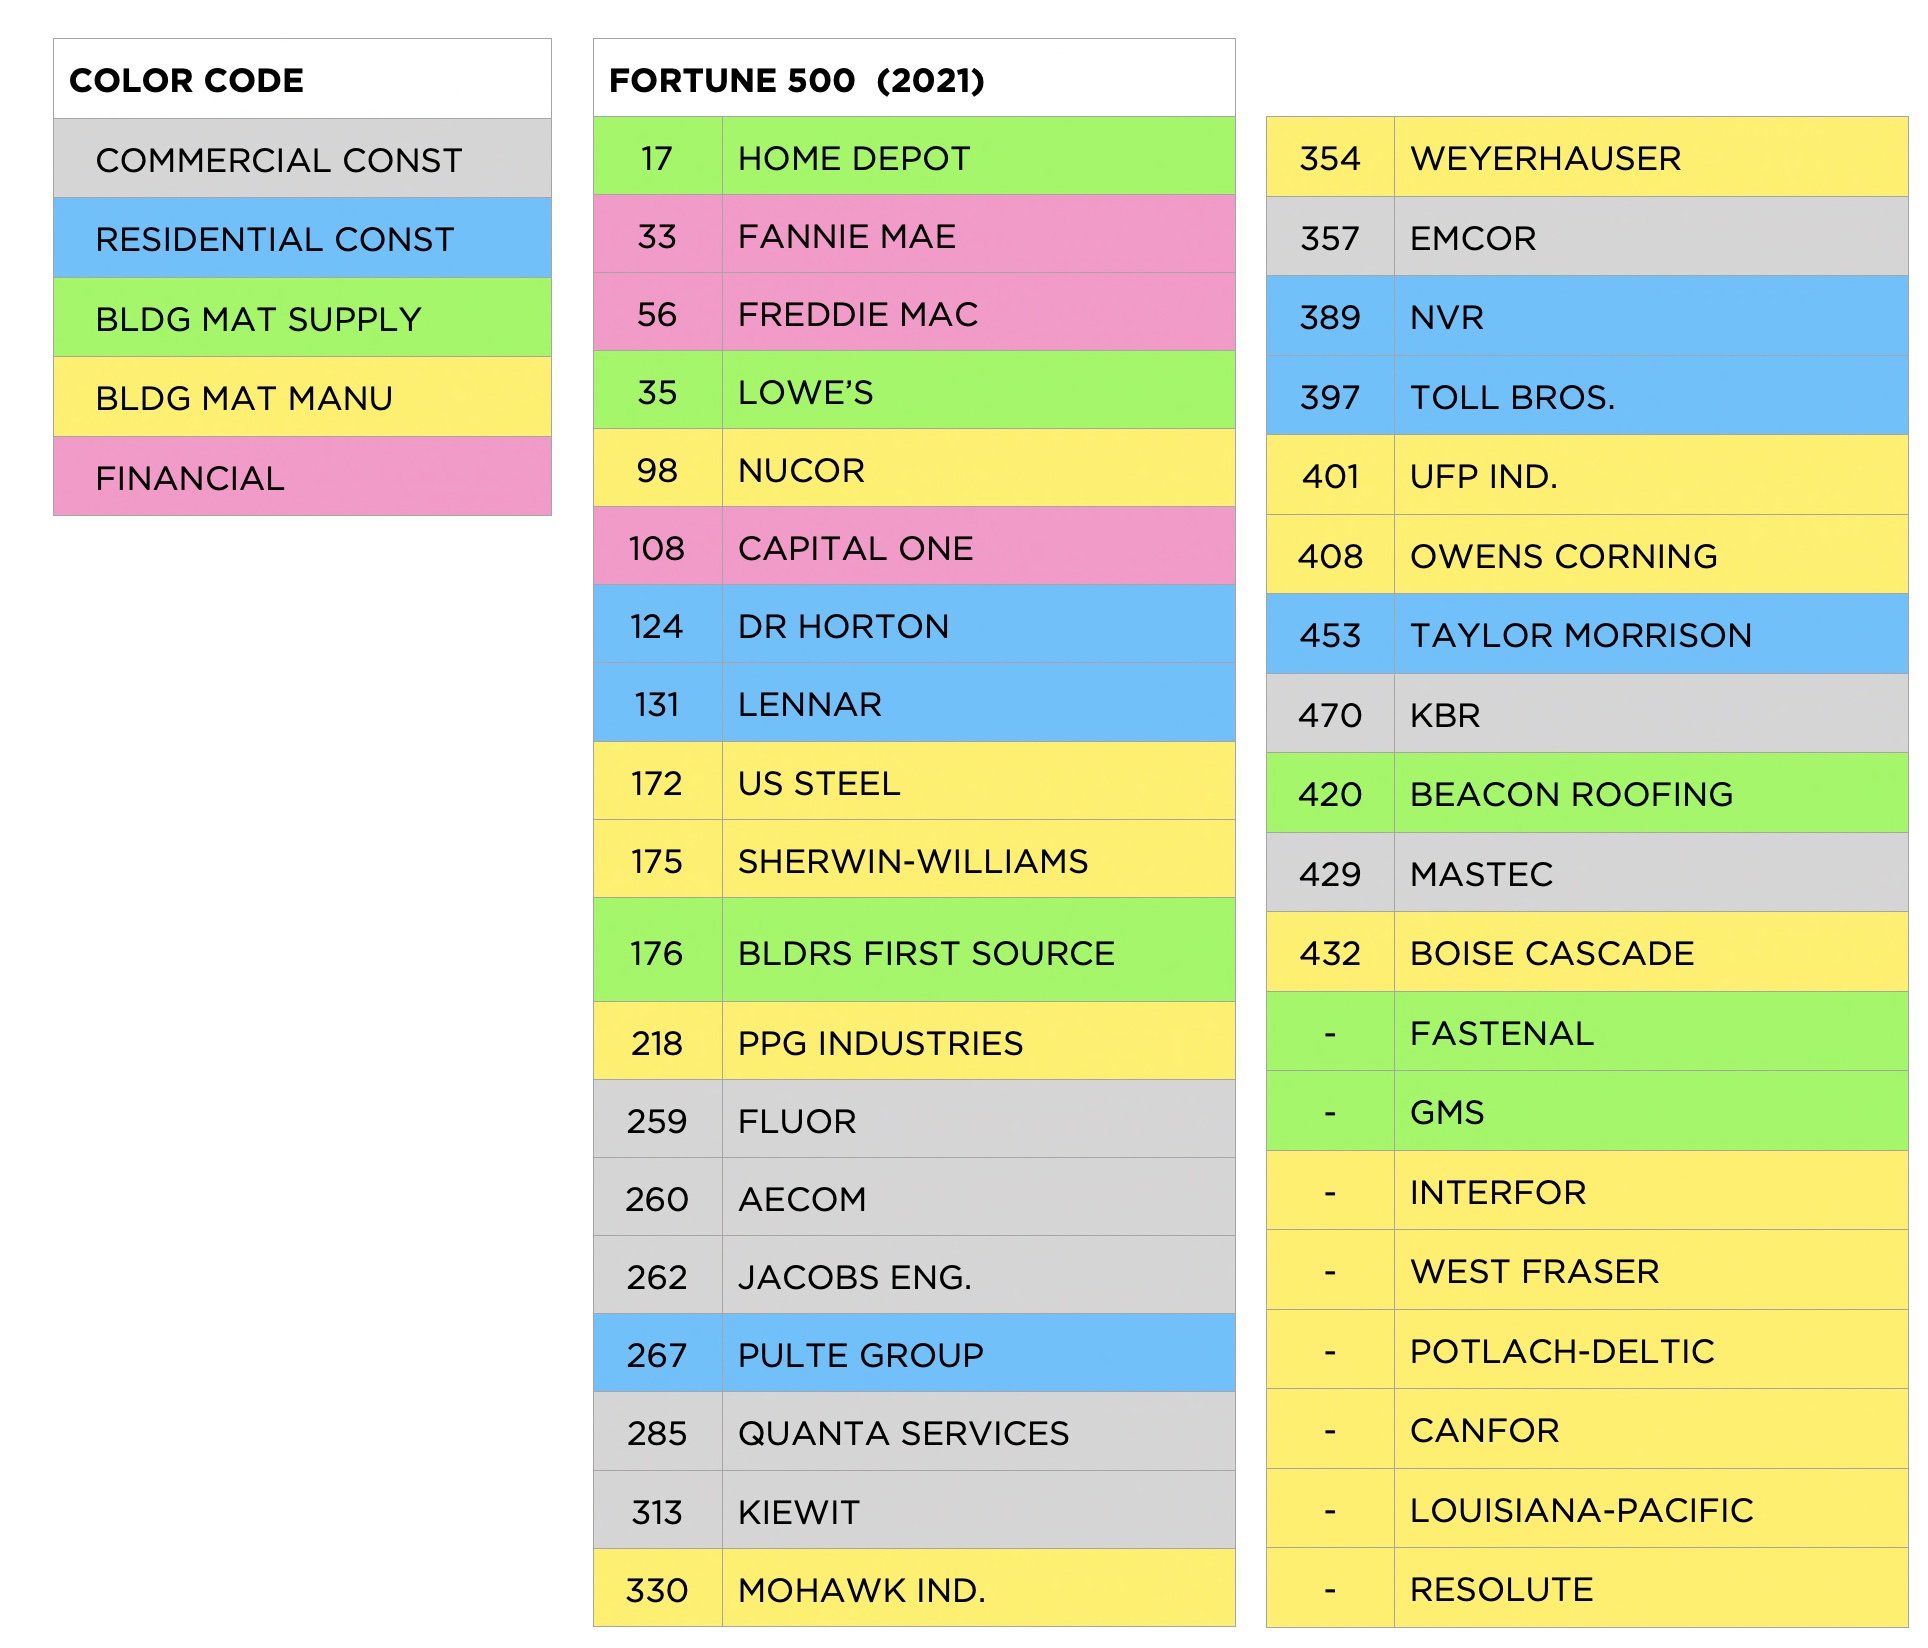
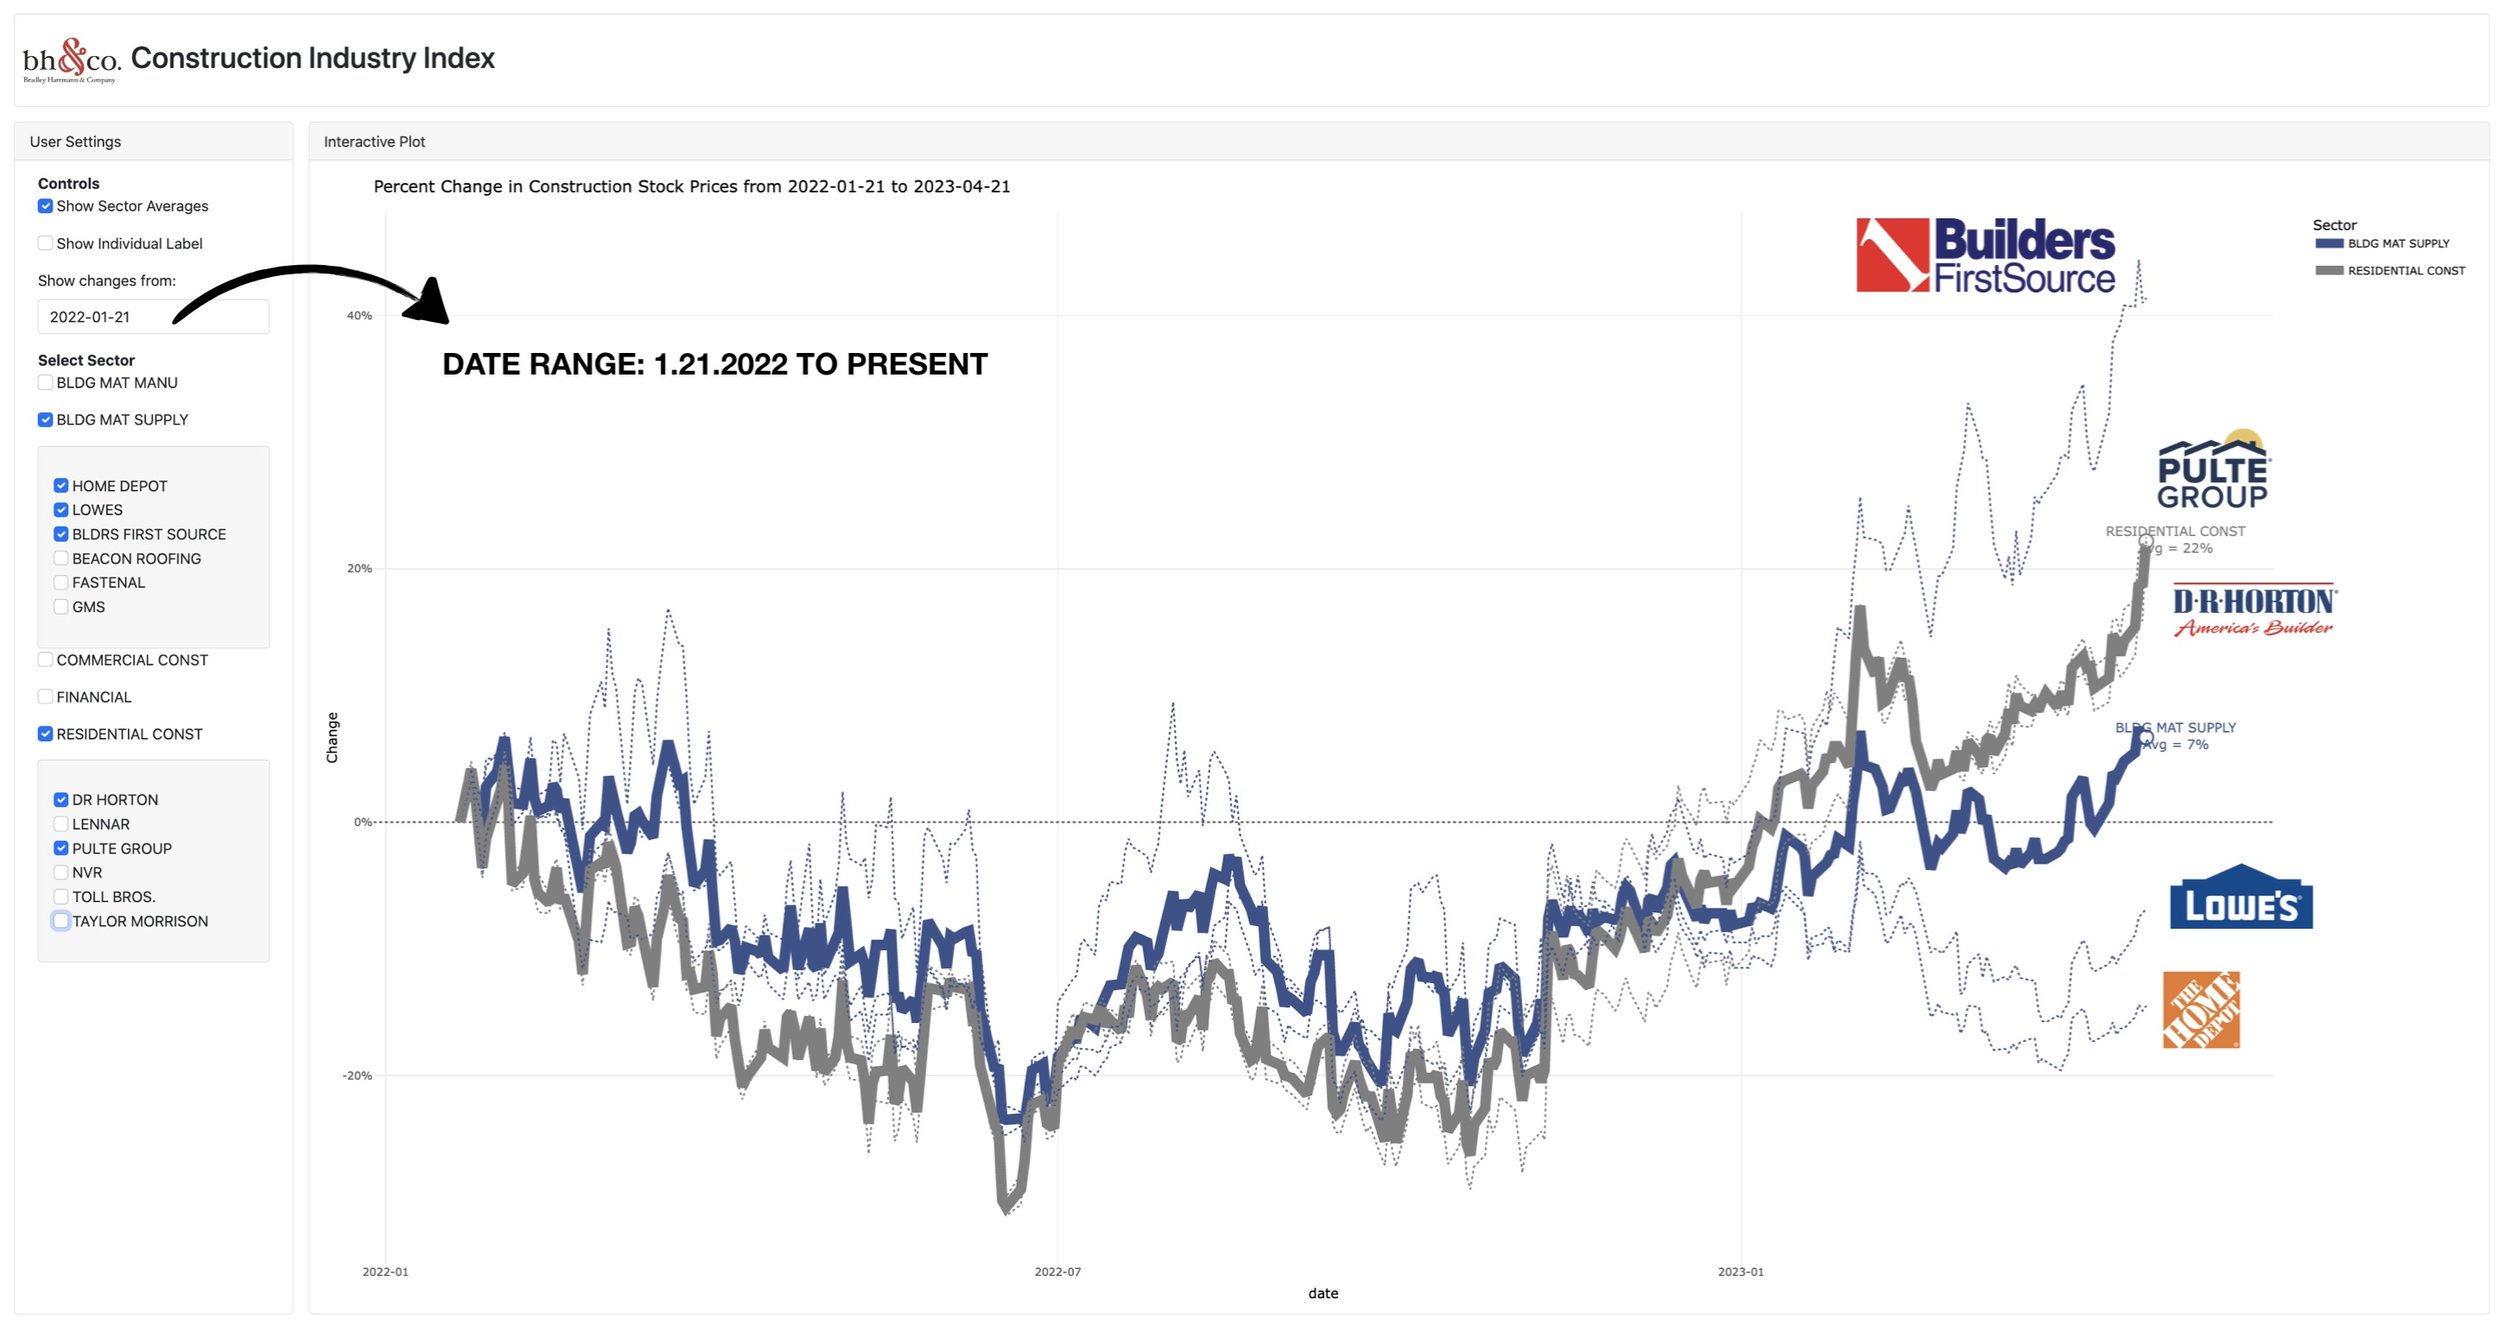
We wanted the ability to compare entirely different segments (Commercial v. Residential) and/or different firms from different segments (Home Depot v. Builders First Source v. DR Horton) over different time frames.
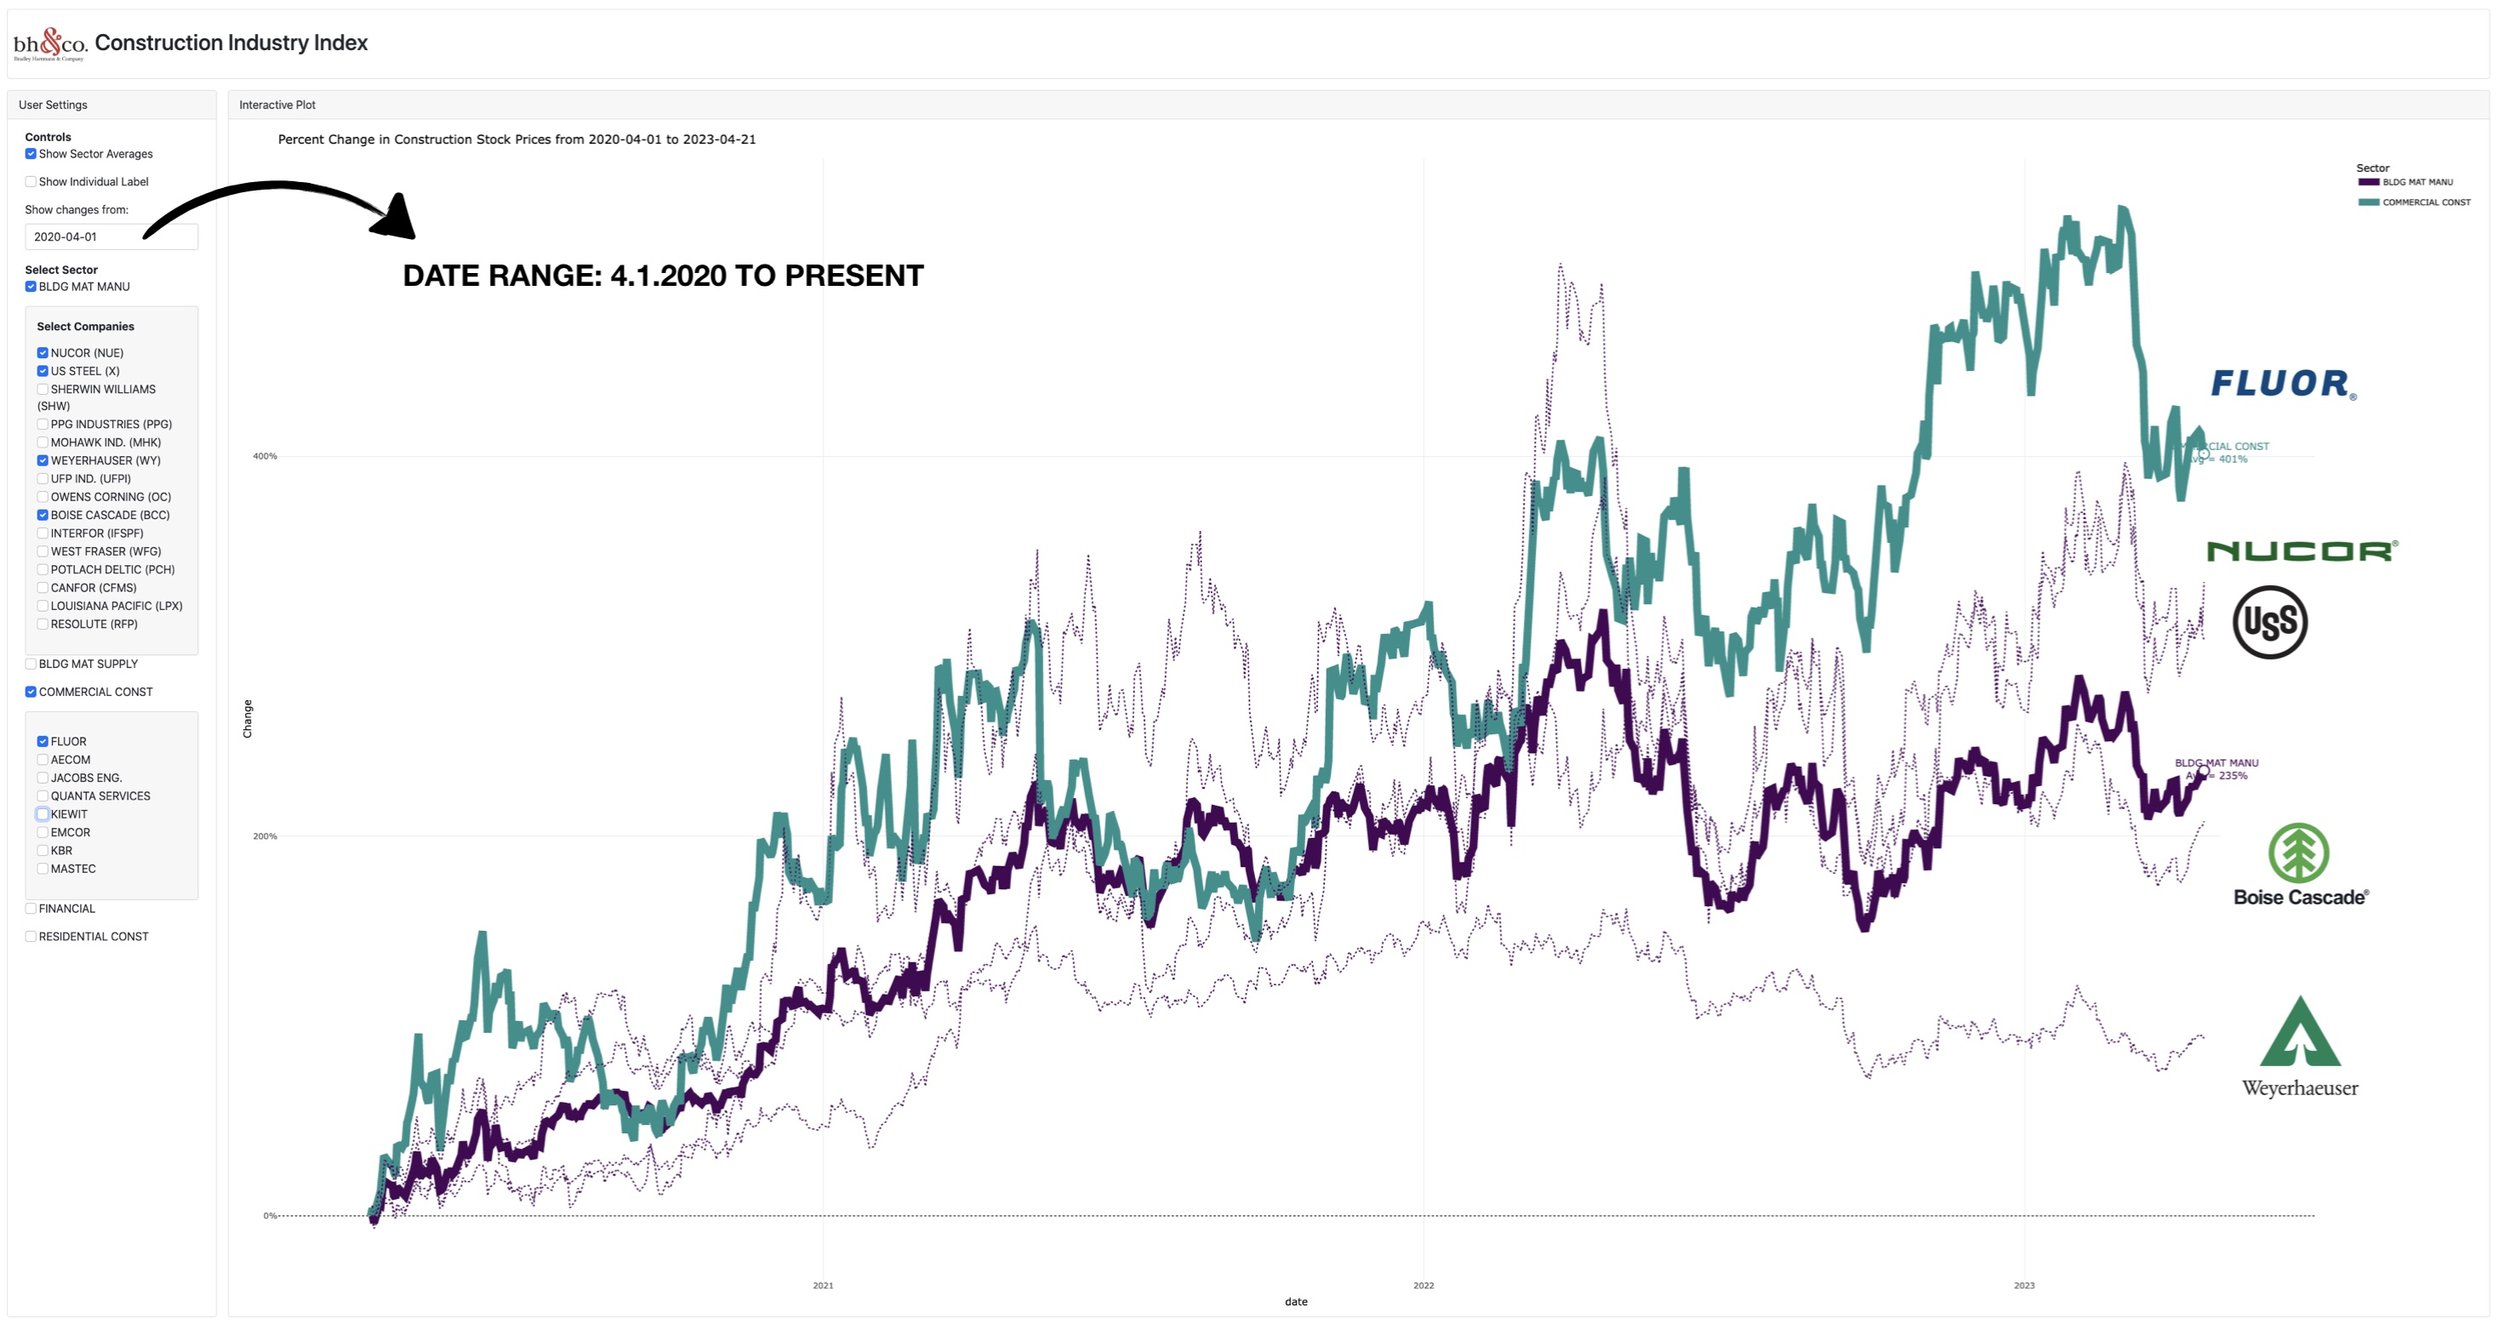
Given the wide range of potential individual stock prices, we chose to base the data visualization on price variance over a selected time frame.
Below are several screenshots that we hope you may find interesting and valuable.

If interested in accessing the bh&co. Construction Index (for free, of course), email me at bradley@bradleyhartmannandco.com.